Get Certified for Financial Modeling (FMVA)®
Gain in-demand industry knowledge and hands-on practice that will help you stand out from the competition and become a world-class financial analyst.
Measuring differences between actual sales and expected sales
Revenue Variance Analysis is used to measure differences between actual sales and expected sales, based on sales volume metrics, sales mix metrics, and contribution margin calculations.
Information obtained from Revenue Variance Analysis is important to organizations because it enables management to determine actual sales performance in relation to the projected or perceived performance of the company for specific products. It helps businesses identify which products are performing better in the market.
Revenue analysis should also consider customer concentration, as dependence on a small number of clients can distort growth trends.
Overall, variance analysis enables management to make more informed strategic and business-level decisions, thereby maximizing profitability.
Learn to perform revenue variance analysis in our online forecasting course.
Similar to variance analysis, we can use the same column-based approach to calculate the four different types of revenue variance.
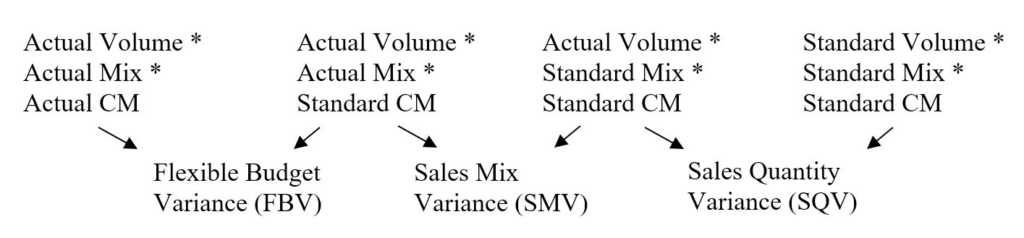
And finally, Sales Volume Variance (SVV) = Sales Mix Variance + Sales Quantity Variance.
The above variances are summarized in the following table:
| Difference between the actual contribution margin and the standard contribution with sales mix and sales volume held constant | Difference between the actual product mix and the standard product mix with sales volume and contribution margin held constant | Difference between the actual volume of sales and the standard (estimated) volume of sales with sales mix and contribution margin held constant |
Data from XYZ Company with equal Actual CM and Budgeted CM.
| Standard Ticket | Luxury Ticket | |
|---|---|---|
| Contribution Margin | $20 | $5 |
| Budgeted tickets sold | 4,000 | 6,000 |
| Actual seats sold | 3,300 | 7,700 |
To determine the relevant variances, we use the column method shown above.
First, organize a table that outlines all relevant information regarding the two products.
| Budget | Actual | |||||
|---|---|---|---|---|---|---|
| Volume | Sales Mix (%) | CM | Volume | Sales Mix (%) | CM | |
| Standard | 4,000 | 40% | $20 | 3,300 | 30% | $20 |
| Luxury | 6,000 | 60% | $5 | 7,700 | 70% | $5 |
| Total | 10,000 | 100% | 11,000 | 100% |
Standard Ticket:
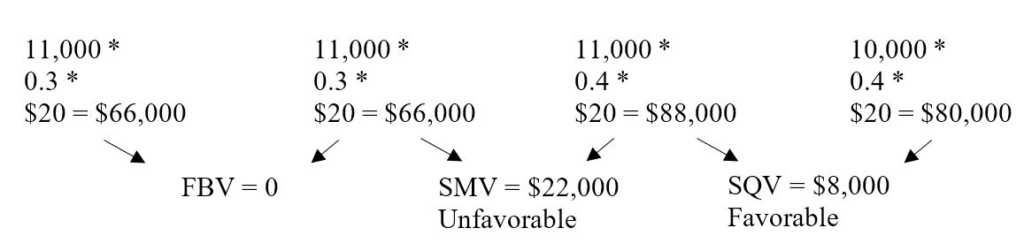
SVV = 22,000 U + 8,000 F = 14,000 U
Luxury Ticket:
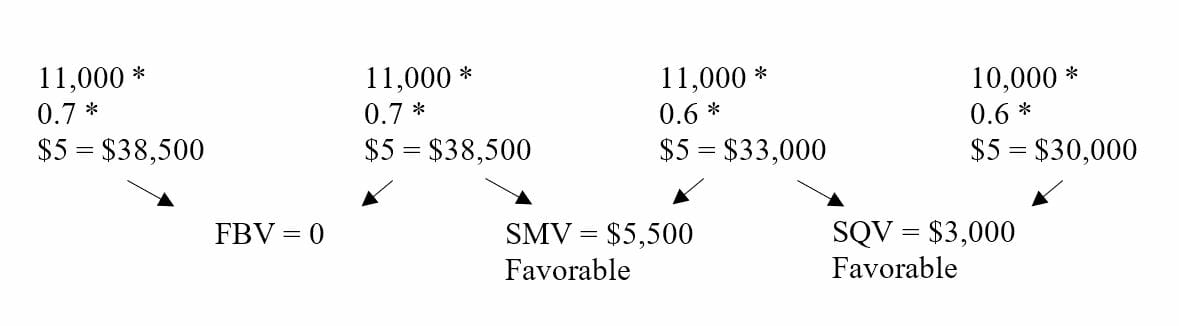
SVV = 5,500 F + 3,000 F = 8,500 F
Click the button below to download the Revenue Variance Analysis template:
From the above example, management can draw several conclusions:
Just like the variance analysis shown above, companies can also take their analysis one step further to determine market share and market size variances. Market share variance is the difference between the actual market share and the estimated/standard market share at the same volume of sales.
On the other hand, market size variance refers to the difference between actual industry sales and estimated industry sales, assuming a constant market share percentage. When the market share and market size variances are combined, they will equal the total sales quantity variance of all products sold by the company.
Learn to perform revenue variance analysis in our online budgeting course.
Variance analysis, as a whole, is imperative for companies because it provides management with information that may not be immediately apparent. By examining all individual costs, sales information, and contribution margin figures, companies can more accurately measure the effectiveness of production methods and the performance of specific products relative to others.
For example, even though a certain product may provide a larger contribution margin, leading to higher profitability, it may actually be performing worse than a lower contribution product. Although the higher CM product may be more appealing in the short run, companies should consider which products to focus their efforts on if they intend to maintain longevity in today’s highly competitive market.
Thank you for reading CFI’s guide to Revenue Variance Analysis. To help you advance your career, check out the additional CFI resources below:


