
Overview
Excel Data Visualization and Dashboards Course Overview
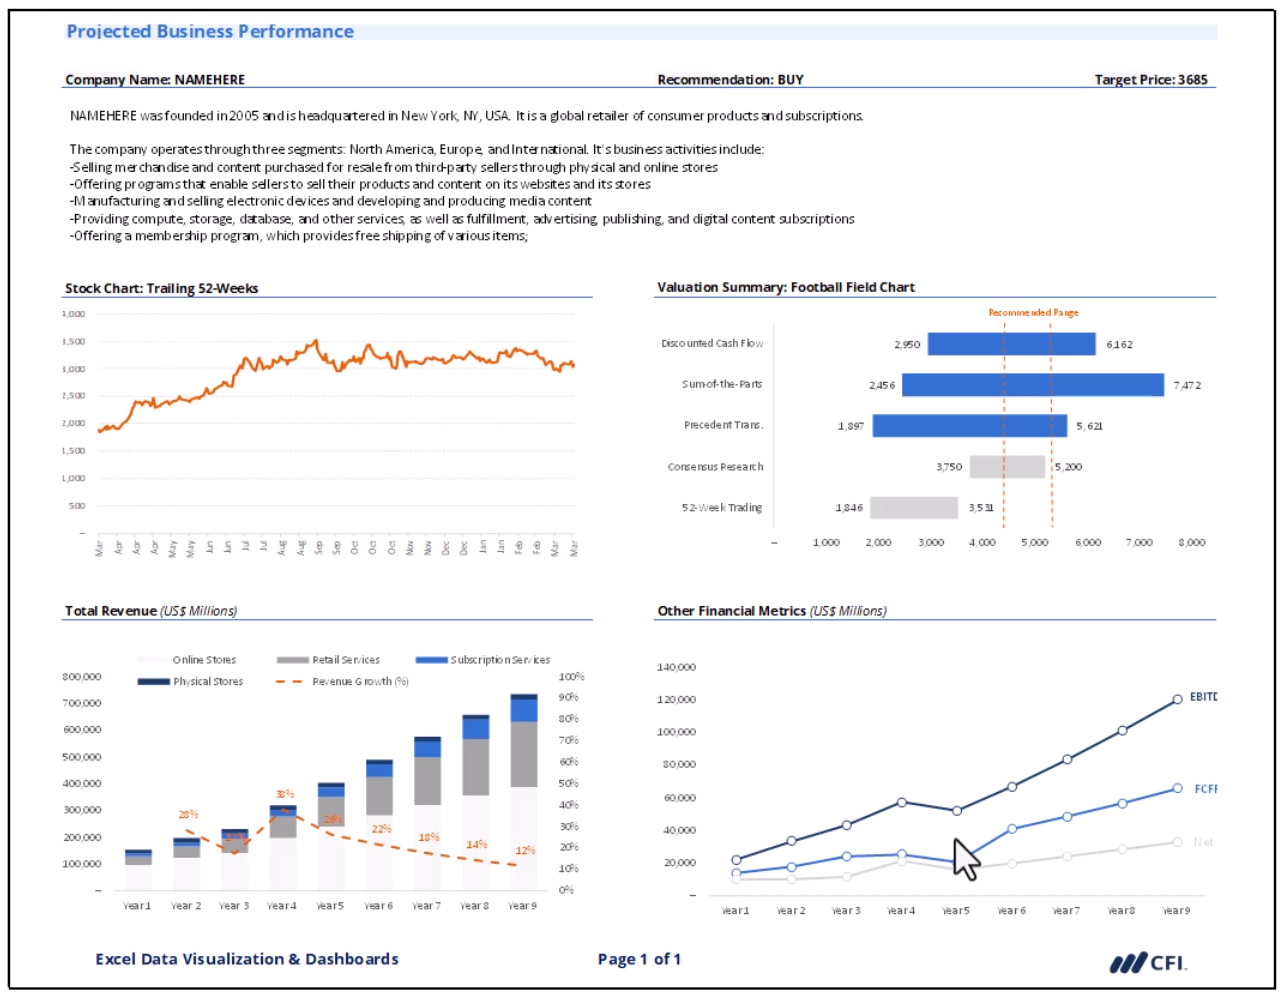
Effective dashboards turn raw data into actionable insights, making them an essential tool for finance and business professionals. In this course, you’ll learn how to build clean, professional dashboards in Excel from the ground up. Through step-by-step instruction, you’ll create two complete dashboards using charts, tables, sparklines, variance analysis, and advanced formatting. By the end, you’ll be equipped to design visuals that not only look polished but also highlight the most important financial insights for decision-making.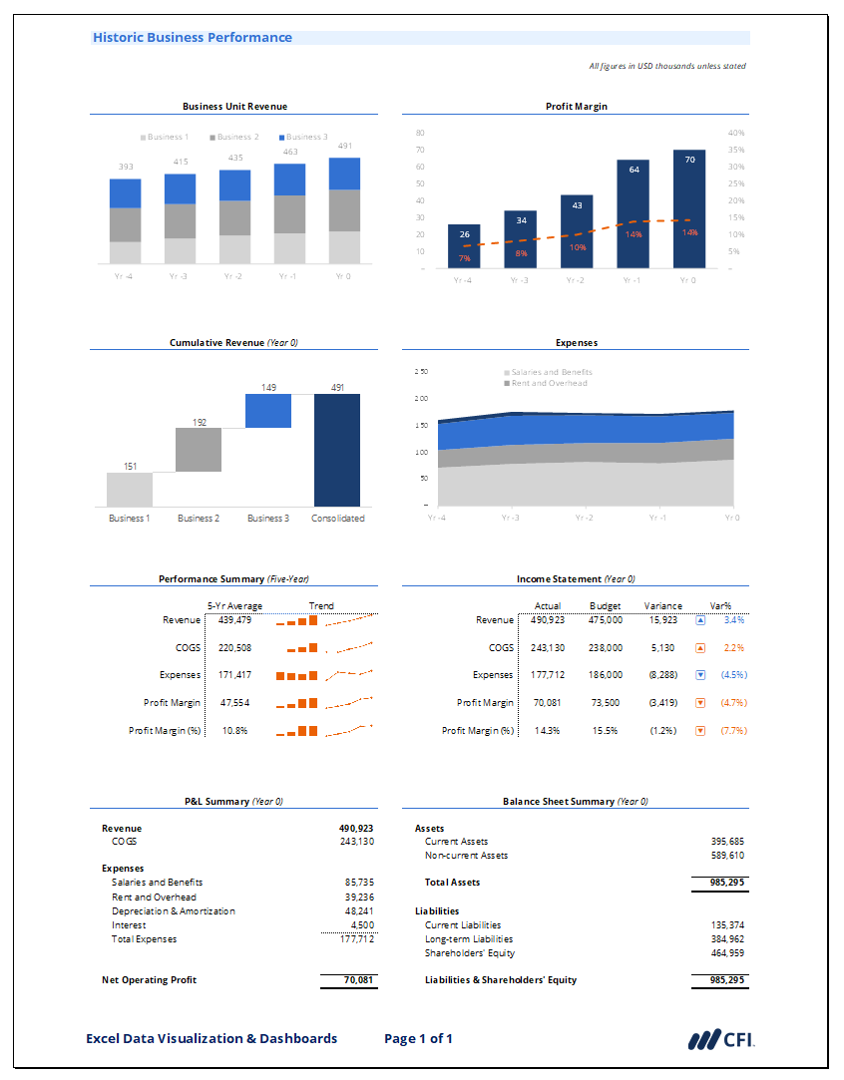
Who should take this course?
This course is designed for finance, accounting, and business professionals who want to strengthen their data visualization skills in Excel. It is especially valuable for those pursuing careers as financial analysts, business analysts, or investment professionals who need to communicate insights effectively.
Excel Data Visualization and Dashboards Learning Objectives
Upon successful completion of this course, learners will be able to:
- Build fully functional dashboards in Excel using charts, tables, and financial data
- Apply visualization best practices to create clear and professional outputs
- Use sparklines, variance analysis, and conditional formatting to highlight insights
- Present revenue, profit, and valuation trends with charts such as the waterfall chart, area chart, and football field chart
- Design dashboards that communicate key takeaways for clients, executives, or stakeholders
Prerequisite Courses
Recommended courses to complete before taking this course.
Prerequisite Skills
Recommended skills to have before taking this course.
- Excel
- Basic computer skills

Level 3
1h 32min
100% online and self-paced
Field of Study: Specialized Knowledge
Start LearningWhat You'll Learn
Building and Formatting Charts (Dashboard 1)
Reviewing Dashboard 1
Building Dashboard 2
Reviewing Dashboard 2
Course Summary
Qualified Assessment
This Course is Part of the Following Programs
Why stop here? Expand your skills and show your expertise with the professional certifications, specializations, and CPE credits you’re already on your way to earning.
Financial Modeling & Valuation Analyst (FMVA®) Certification
- Skills Learned Financial modeling and valuation, sensitivity analysis, strategy
- Career Prep Investment banking and equity research, FP&A, corporate development
Financial Planning & Analysis Professional
- Skills You’ll Gain Accounting, Finance, Excel, Data Analysis, Financial Statement Analysis, Financial Modeling, Budgeting, Forecasting, Power Query, Power BI, Data Visualization, Economics, and more
- Great For The FPAP certification focuses on practical, desk-ready skills that are immediately applicable to current FP&A professionals or anyone seeking to land a role in FP&A
Excel Skills for Professionals
- Skills You’ll Gain Excel, Data Preparation, Data Visualization
- Great For Ideal for business professionals, analysts, and finance specialists who want to strengthen their Excel skills for modeling, data preparation, and reporting.


